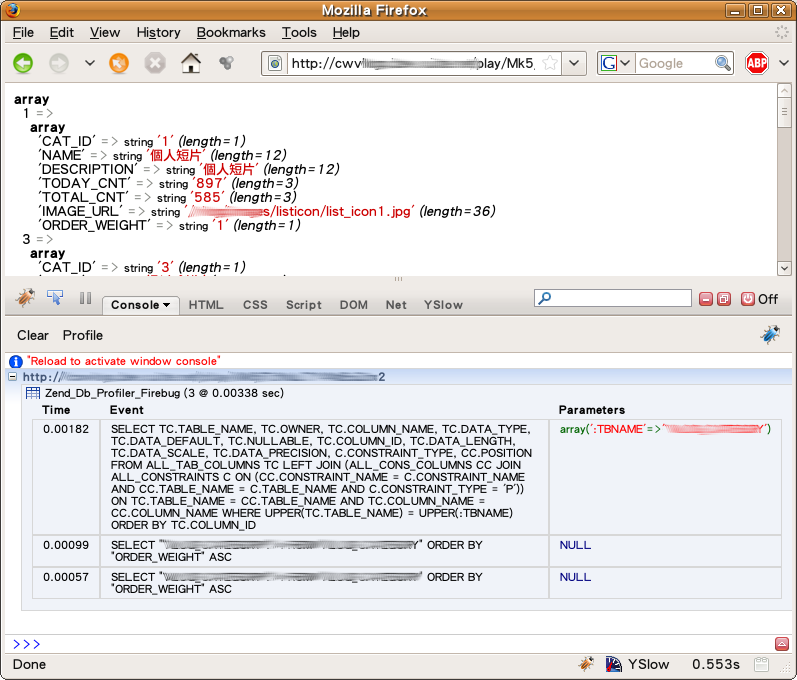
使用 Firebug 來顯示 DB Profiling 的資訊,真的挺好用的。
上面的圖中,就會顯示執行此頁時,所有執行的 SQL 語法。
可參考:Zend_Db_Profiler
環境:
用法如下:
// In your bootstrap file
$profiler = new Zend_Db_Profiler_Firebug('All DB Queries');
$profiler->setEnabled(true);
// Attach the profiler to your db adapter
$db->setProfiler($profiler)
// Dispatch your front controller
// All DB queries in your model, view and controller
// files will now be profiled and sent to Firebug
我是直接在 application > configs > application.ini
裡加上下面資訊,就搞定了。
; 設定 db profiler
resources.db.params.profiler.enabled    = true
resources.db.params.profiler.class      = Zend_Db_Profiler_Firebug
既簡單又方便~
設定好後,所有 DB Profiling 的資訊,都會在 Firebug 上顯示了。
0 comments:
張貼留言